


The shift in automotive production towards trucks, including minivans, CUVs, SUVs, and pickups, is at the very heart of the bull case for autos.
As BlindersOffResearch’s Daniel Ruiz explains, the bull thesis is simple, as the new-vehicle-production mix shifts toward the very profitable truck segment and away from less profitable cars, automaker margins increase. To date, the bull case has been correct, and the shift in production mix has been so extreme that increased margins have been able to offset overall production declines.

In order to successfully invest in the automotive sector for the long-term, I believe one very important question must be answered correctly, Will future demand support the current production strategy in North America?
Judging by the latest headlines from CBS42 in Birmingham, Alabama, the answer is writ large and ominous…
Parking lots in parts of central and western Alabama are filling up with Mercedes SUVs, and it has some people wondering what’s going on.

Century Plaza in the Crestwood section of Birmingham is filled with hundreds of cars. More arrived Thursday and Friday.

Mercedes released a statement about it to CBS 42 Thursday, saying it stems from the production of the new Mercedes GLE, which began in late 2018, “it is a challenge we are working to jointly master with both our existing and new suppliers… As a result, we are using a number of locations in the plant and off-site locations nearby for the storage of those vehicles as temporary storage for our vehicles.”

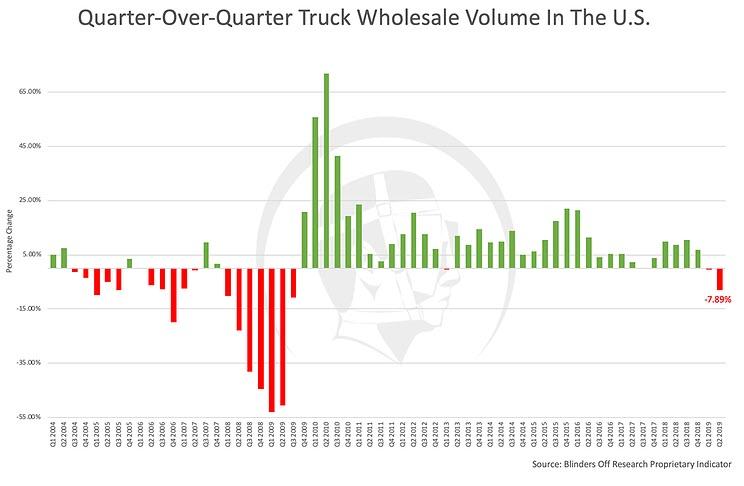
We have seen worrisome stockpiling images like this before (here and here most recently), but as BlindersOffResearch’s Daniel Ruiz details, there’s no better measure of demand than actual sales transactions (not desire or intention). I say that because actual transactions represent willing and able buyers. Those willing and able buyers have opted for trucks at a historic rate in the last 3 years.

The chart above is perhaps the most important for the bull case and also the most misunderstood. If you ask most investors, economist, and industry experts what led to such a large shift in car and truck demand, the most common answer you’ll get is gasoline prices since U.S. consumers naturally prefer larger vehicles. Gasoline prices are also a central part of the bear case since many manufacturers have all but given up on sedans and are now overly exposed to a potential decline in truck demand.

So, do I agree or more importantly, does the data support that gasoline prices are the main driving force behind truck demand?
It’s easy to understand why gasoline prices get most of the attention if we focus solely on the sharp decline in truck sales mix and the sharp increase in gasoline prices from 2005 through 2008. However, when we take a closer look, we can see that after the mix of truck sales bottomed in 2009, there is little to no correlation between truck mix and gasoline prices.

The same goes for the car segment which lost market share to trucks from 2009 till 2012 while gasoline prices increased and failed to change the downward trend in 2016 when gasoline prices bottomed.

Gasoline prices definitely played a role in pressuring truck demand before and during the recession. However, fuel economy improvements since our last recession have made gasoline prices a much less reliable indicator for truck demand.

The dramatic shift in sales to the truck segment is the strongest contributor to the bull case but also the biggest threat if the mix of sales shifts back towards cars as it has in the past. So, if not gasoline prices, then what causes the cyclical shifts in sales mix between cars and trucks? If you’d like a comprehensive answer to that last question, please contact us for pricing information.
If what I’ve said so far hasn’t convinced you to dig a bit deeper, perhaps the chart below will (Q2 of 2019 only illustrates a year-over-year comparison for April).
Source: BlindersOffResearch.com
via zerohedge


